Upload your own Sailmon MAX with Calypso data for analysis in 3 quick steps:
 3 Steps to visualize your polar diagram from Sailmon MAX plus Calypso Ultrasonic Anemometer:
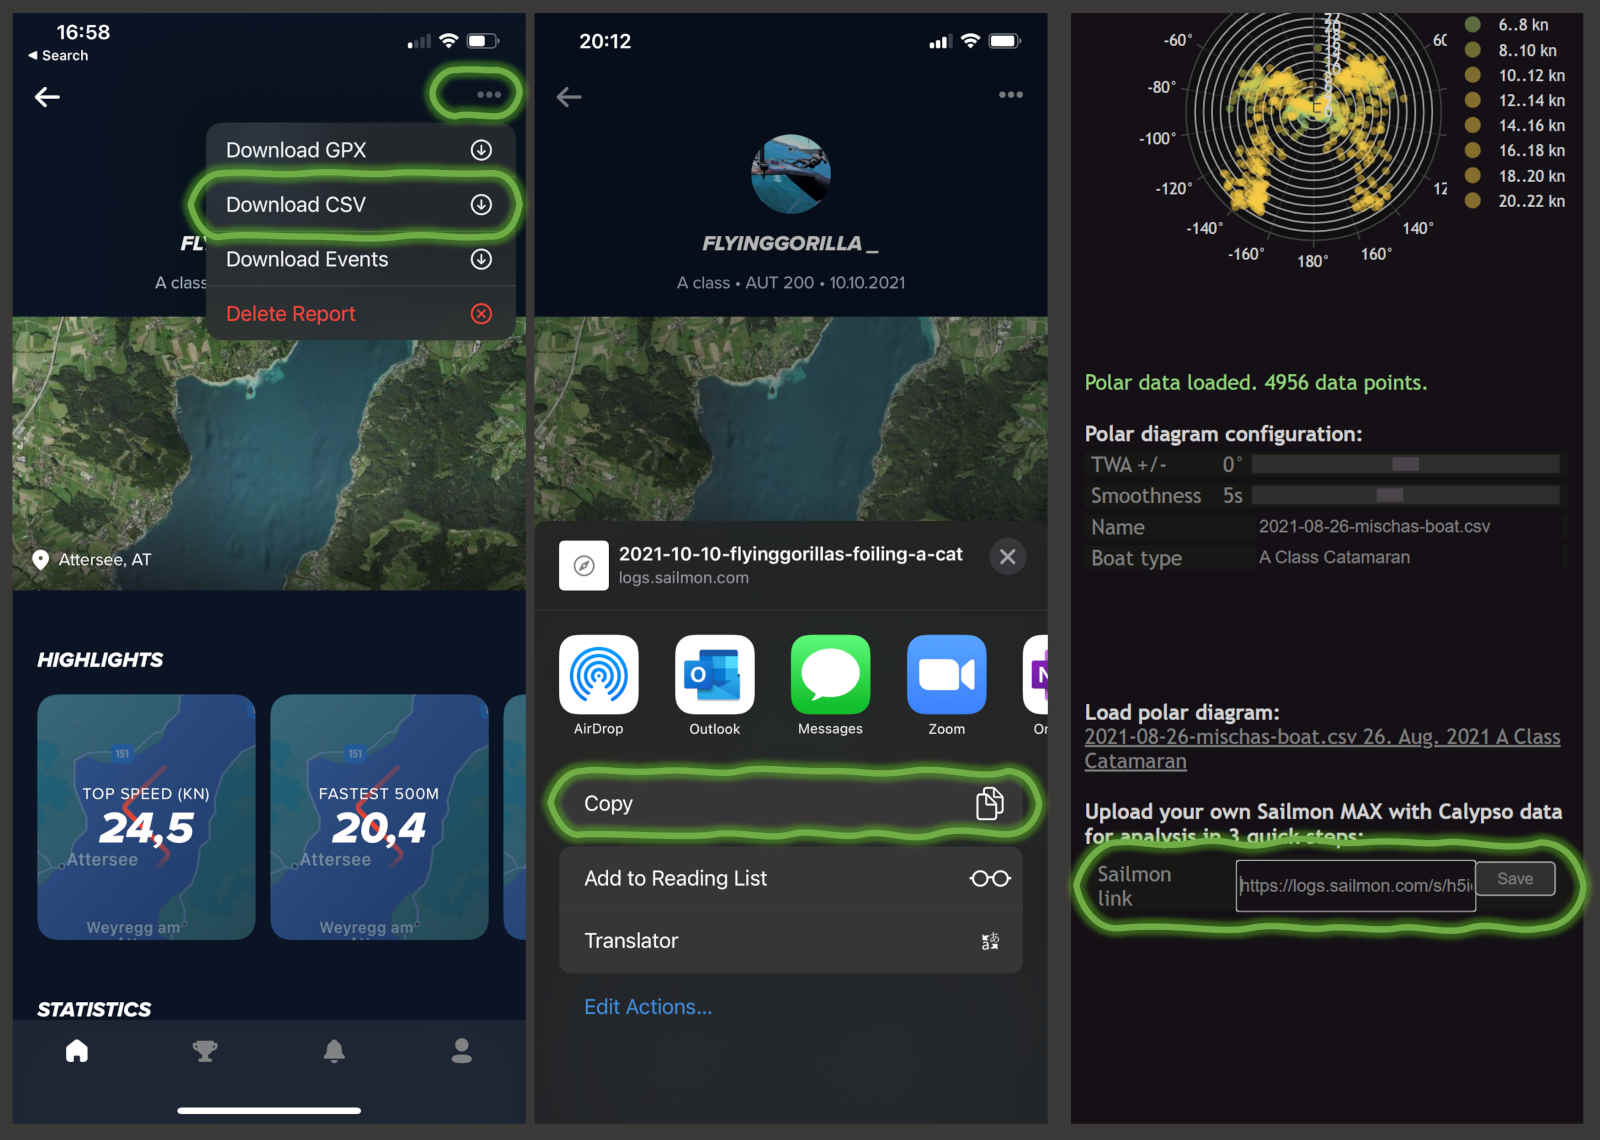
- Launch Sailmon MAX app and go to personal activities
- Generate and copy the CSV data link
- Paste the link in the upload field of the polar visualization app and save.